Processing many samples at once with collections
On this page
- has a basic understanding of how Galaxy works (if you don’t, please see Galaxy 101 tutorial)
- has an account in Galaxy (see this if you don’t)
- has their browser configured as described here
In Galaxy you perform data analyses and organize your data simply by clicking on things. If you have just a few items in your history, clicking is easy. However, in most real-world analyses you never have just a few datasets, instead you have many (sometimes thousands) and Collections help manage your data to minimize the amount of clicking you have to do.
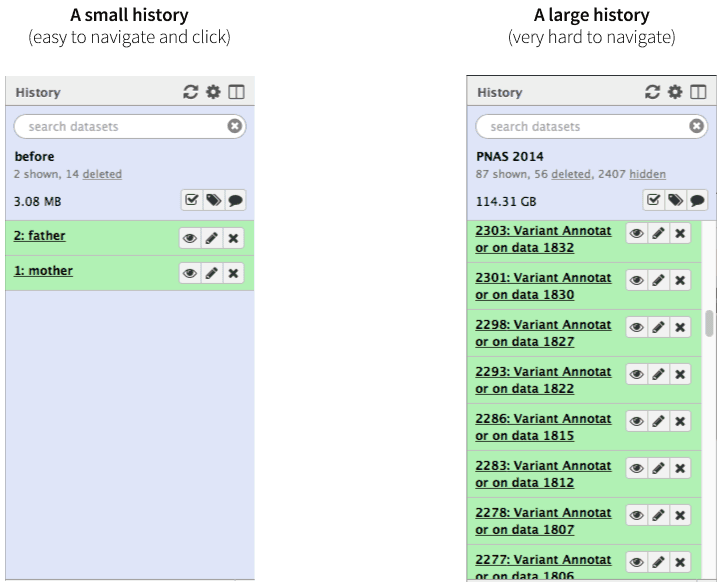 |
| Figure 1. A history with few datasets is easy to navigate. A history with many datasets is hard to navigate. |
Not only may clicking on thousands datasets lead to a severe form of carpal tunnel syndrome, it may simply be impossible. Collections (also known as Dataset collections or Lists) described here help to resolve this situation and make very large analyses Galaxy-friendly.
Collections combine datasets to minimize clutter
A typical multi-dataset analysis of next-generation sequencing (NGS) data usually involves a large number of sequence datasets, such as, for example, fastq datasets generated by an Illumina machine or downloaded from a Short Read Archive. So it’s usually a collection of similar things that need to be processed in a collective fashion:
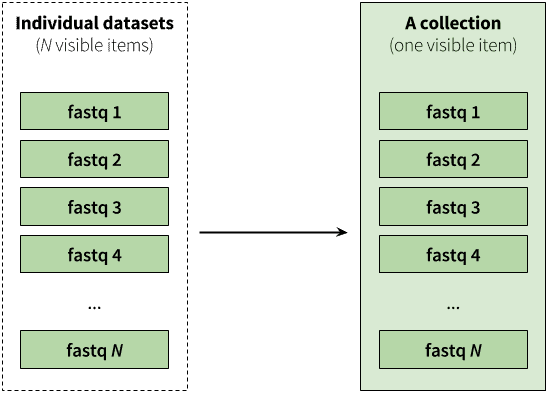 |
| Figure 2. A collection is any number of datasets bundled as a single entity. In this example, to, say, map N fastq files against the human genome you need to manually start N mapping jobs. Yet if you first combine individual datasets into a collection, you will only need start a mapping job once using the collection as the only input. |
Collections reflect data complexity
The previous image shows how multiple fastq datasets can be combined in a single collection. But what if the sequencing data one wants to analyze is from a paired-end (or mate-pair) run where each individual sample is represented by two fastq files: forward and reverse? Galaxy collections can accommodate this structure:
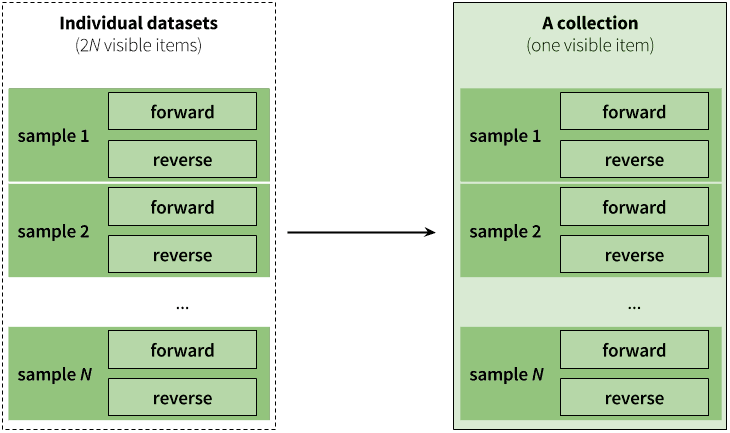 |
| Figure 3. Paired collection preserves the relationship between read pairs and their respective samples. |
Creating collections in practice
Below we explain how collections can be used in Galaxy. We start with an example where datasets are already in your history. Later in this tutorial we explain how to upload data into collections directly.
Creating a collection from datasets in your history
As was mentioned above in Galaxy’s language there are two interchangeable terms: a collection and a list. This is because the simplest collection is just a list of datasets.
A simple collection example
In this example we have six datasets representing single-end (not paired-end) sequencing datasets from six patients. The datasets are already loaded in the history.
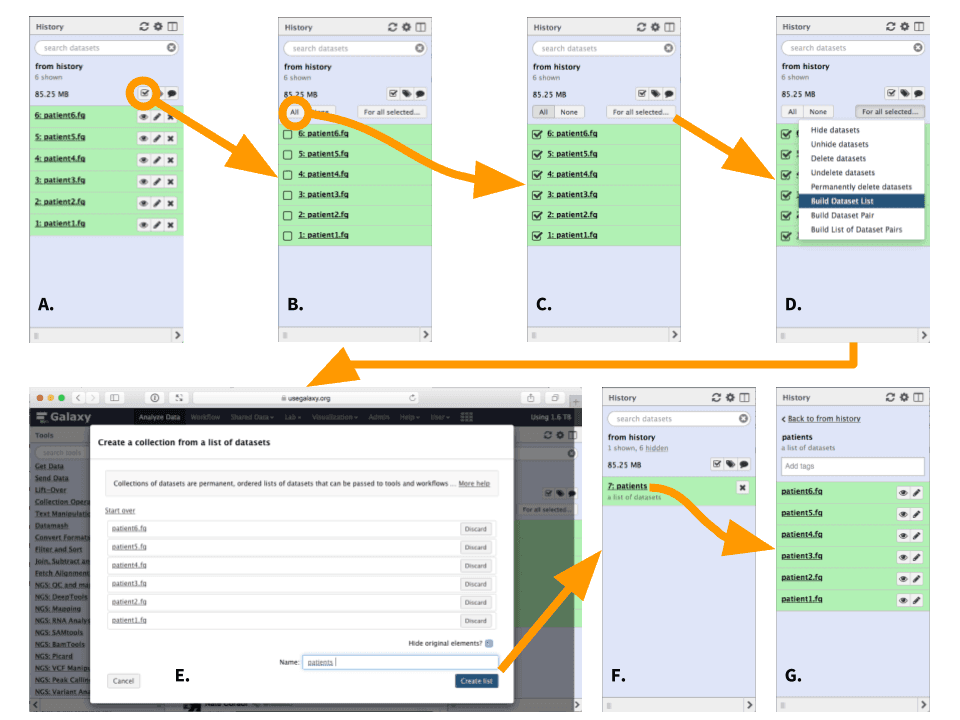 |
| Figure 4. Creating a list (collection) or datasets (To see a higher resolution image right-click here). A. Click the checkbox icon. This will reveal checkboxes to the left of all datasets in the history. B. In this case we want to select all datasets, so press “All” button (alternatively datasets can be filtered as shown here). This will put a check mark into all checkboxes. C. Click “For all selected…” button. This will reveal a dropdown. D. Since this is not paired-end (or mate-pair) data we will choose to “Build Dataset List”. This will open a dataset collection creator interface. E. Within the dataset collection creator interface use the “Name” box to name the collection. “Hide original elements” checkbox ensures that upon creating the collection the original datasets will be hidden from the history as shown in the next figure. Click “Create list”. F. A collection named “patients” is now added to the history and original datasets are hidden, so that the history only has one item. G. Clicking on collection reveals its content. |
A paired collection example
In this example we have data from three patients. Each is sequenced in paired-end configuration. This means that there are 3 x 2 = 6 datasets. Just like in the previous example these data are already pre-loaded into history. Note that the datasets are named in the following way:
| Name | Description |
|---|---|
patient1-f | Forward dataset for patient 1 |
patient1-r | Reverse dataset for patient 1 |
patient2-f | Forward dataset for patient 2 |
patient2-r | Reverse dataset for patient 2 |
patient3-f | Forward dataset for patient 3 |
patient3-r | Reverse dataset for patient 3 |
This is important because the fact that -f and -r differentiate forward and reverse datasets will be used by collection creator to organize them into pairs (panel B of the figure below). Obviously, there may be other ways forward and reverse read datasets are identified such as -1 and -2 or forward and reverse or any other way. These can be used in exactly the same way we use -f and -r here.
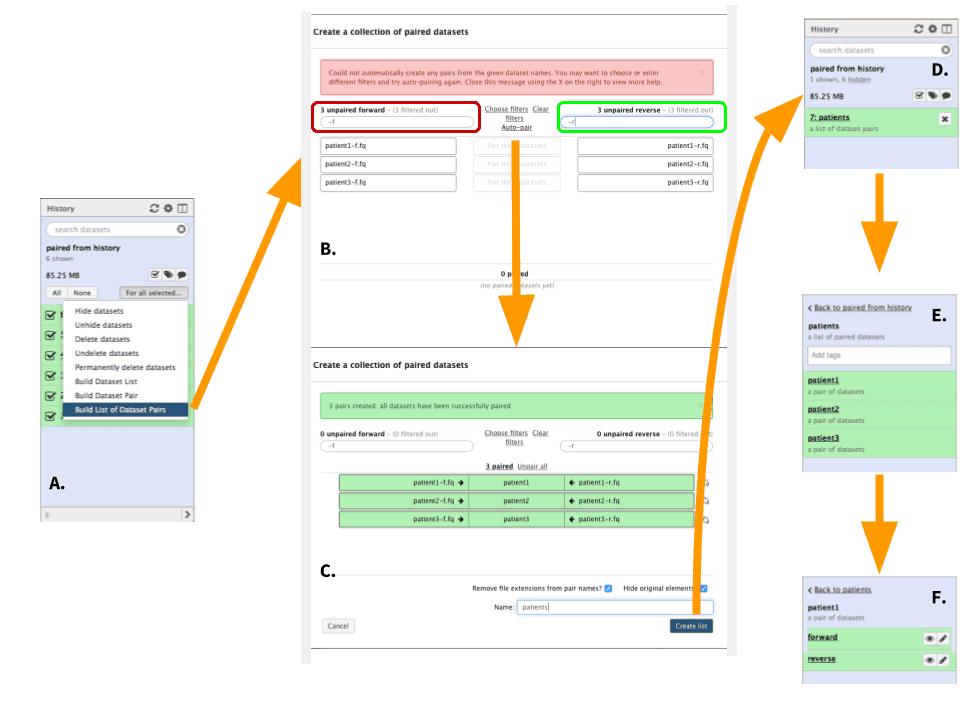 |
Figure 5. Creating a list (collection) or datasets (To see a higher resolution image right-click here). The starting steps are identical to steps A through C of the previous example (Figure 4). A. Here choose “Build List of Dataset pairs” to open dataset collection creator. B. In the left text box (highlighted in red) enter -f. These two characters distinguish forward datasets in our case. Once this is done matching datasets will appear underneath the text field. In the right text box (highlighted in green) enter -r. These two characters distinguish reverse datasets in our case. Again, matching datasets will appear under the box. Finally, click “Auto-pair”. C. Auto-pairing will form dataset pairs. At this point scroll to the bottom of the form, name the collection, and click “Create list”. D. A new collection will appear in your history. Clicking the collection will reveal its content. E. In this example the collection consists of three pairs. F. Clicking on any pair will reveal forward and reverse sequence datasets. |
Uploading data directly into collections
You can upload data into collections directly bypassing the need to upload datasets into history first.
Uploading from local disk
If you have datasets stored on your computer, you can upload them into collection as shown in following video.
This approach only works for a relatively small (dozens) number of small (below 2GB) datasets due to limitations of web browsers.
Uploading from FTP
A more robust, preferred way of uploading data is through FTP. For this you need to use an FTP client (such as FileZilla used here) to upload data into Galaxy. Use your galaxy URL address (http://usegalaxy.org for the main site), username, and password as shown in the following video:
Uploading from short read archive
Finally, if the data you are uploading has been deposited to the Short Read Archive (SRA) at NCBI use this approach:
Manipulating collections
Collections can renamed, tagged, and manipulated in a number of ways described below.
Renaming collections
To rename a collection click on its name:
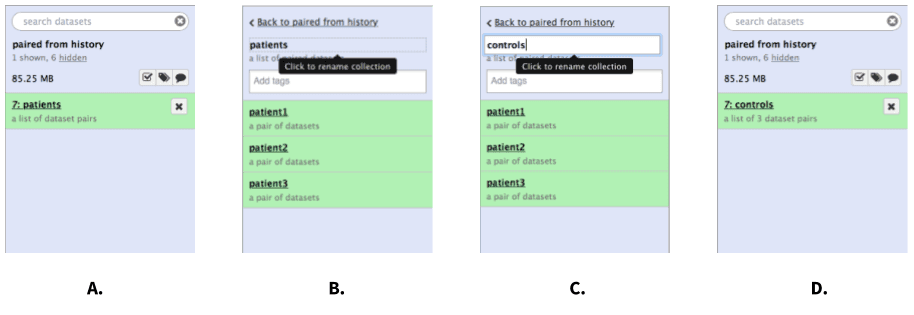 |
| Figure 6. Renaming a collection. A. Click on the collection. B. Once the collection expands, click on its name. C. Enter a new name and hit Enter. D. Go back to history (click “Back to…” link). You may need to refresh the history by clicking on the refresh icon. |
Tagging collections
There are two types of tags that can be used as an additional level of labeling for collections: standard tags and hashtags (also known as propagating tags). Standard tags add another level of description to collections making them easier to find. Hashtags are much more powerful as they are displayed in the history panel and propagate through the analysis:
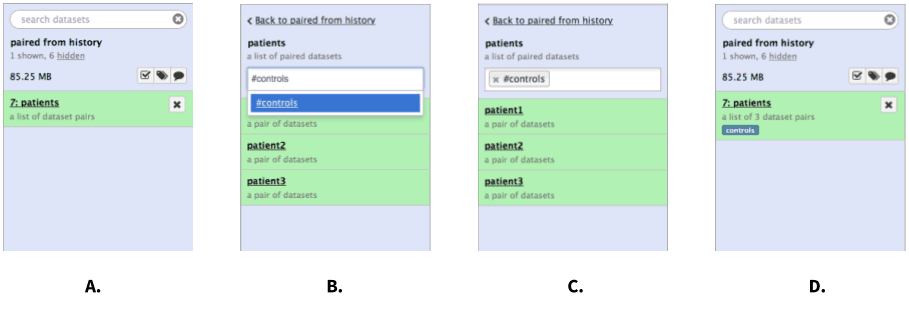 |
Figure 7. Tagging a collection. A. Click on collection. B. Once collection expands, type tag name in the tagging box. If you want the tag to propagate through the analysis add the hash (#) symbol in front of the tag as shown here. C. Hit Enter and go back to history by clicking the “Back to…” link. D. The collection is now tagged. |
The following video shows the power of hashtags:
Using dataset collection tools
Galaxy contains a special set of tools - Collection operations - designed for transforming existing collections. The following figure highlights the possibilities:
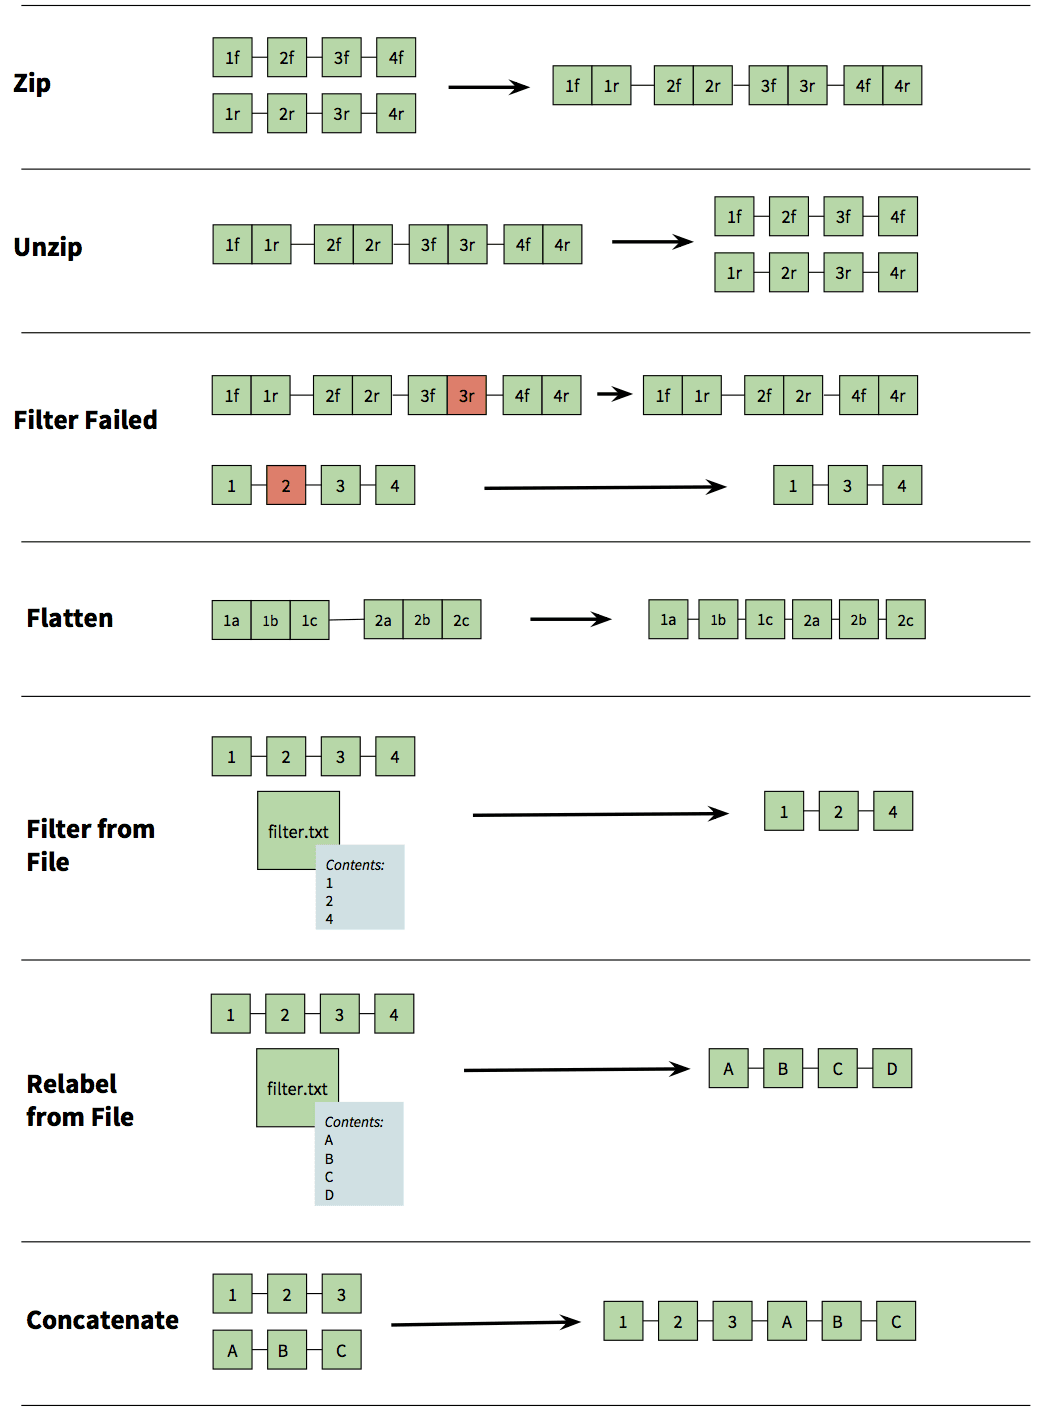 |
| Figure 8. Collection operations. Zip - combines two collections as a zipper. If you, for example, have two collections representing forward and reverse reads, respectively, this tool can be used to combine them into a single paired collection. Unzip - performs opposite of Zip. Filter Failed - when running analyses on collections it is possible that some individual analyses on collection elements will fail. This tool allows you to filter out failed elements so you can continue your analysis instead of performing it again. Flatten - squish collection into a simple list of elements. Filter from File - given a file of collection element IDs reduce the collection to only a subset of elements listed in the file. Relabel from File - use labels in the file to change the collection element names. Concatenate - merge two collection tail-to-head. |
Using collections
Earlier in this tutorial we demonstrated what collections are, how they can be created, and manipulated. Now let’s have a short usage example.
Collections are reduced during an analysis
We will start with a paired collection of fastq reads, map them to the human genome, and process mapping results. In this example the collection is being reduced to a single dataset as we progress through the analysis pipeline:
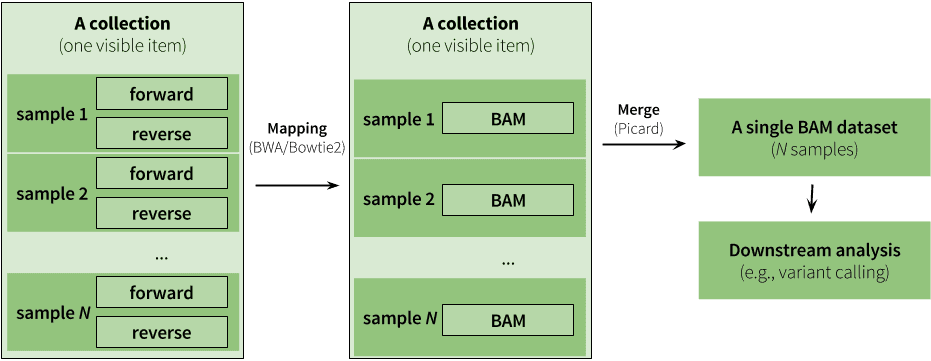 |
| Figure 9. An example of an analysis using collections. Here analysis begins with a paired collection containing fastq datasets. The entire collection is mapped using BWA (or Bowtie2). The maping step produces another collection as output but this collection is no longer paired (mappers use paired fastq reads to generate a single BAM dataset from each pair). Instead it is a simple list of BAM files. During mapping (see below and also see this tutorial) we set read groups within individual BAM datasets. This effectively labels each read with its origin (e.g., we know that read came from, say, sample 1). Because of this we can merge the entire collection of BAM files into a single BAM dataset. Thus - we start with a collection and finish with just a single dataset. |
We we start with loading a collection into history using any of the methods that have been discussed above:
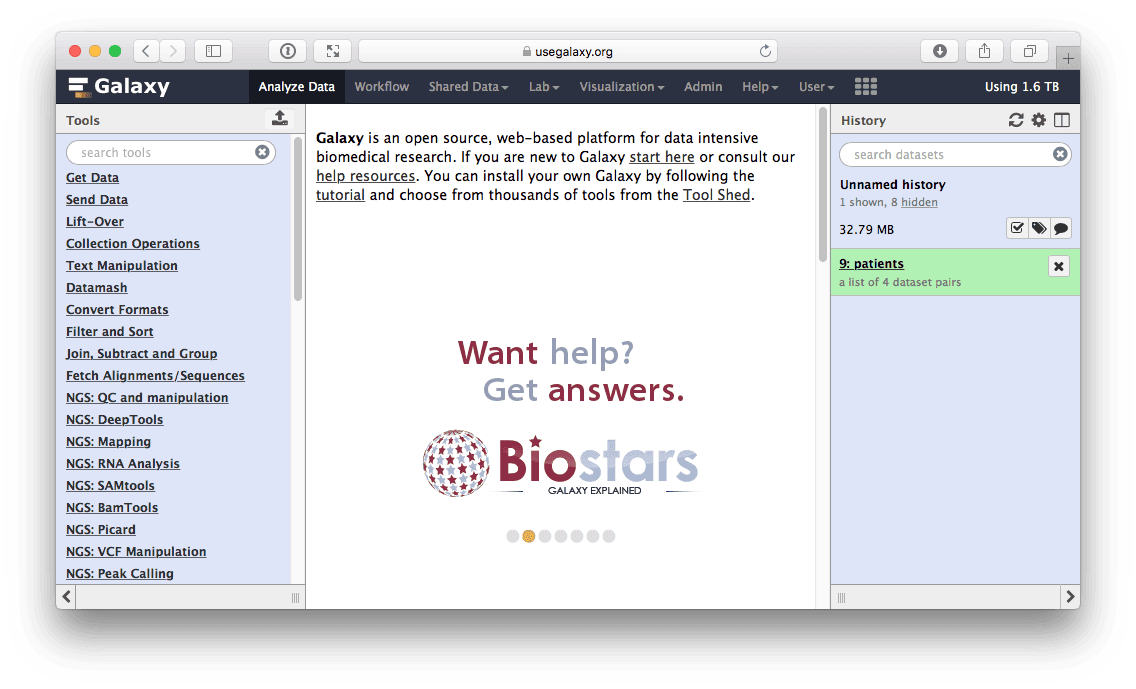 |
| Figure 10. A collection is loaded into Galaxy’s history. |
Next, we will tag this collection:
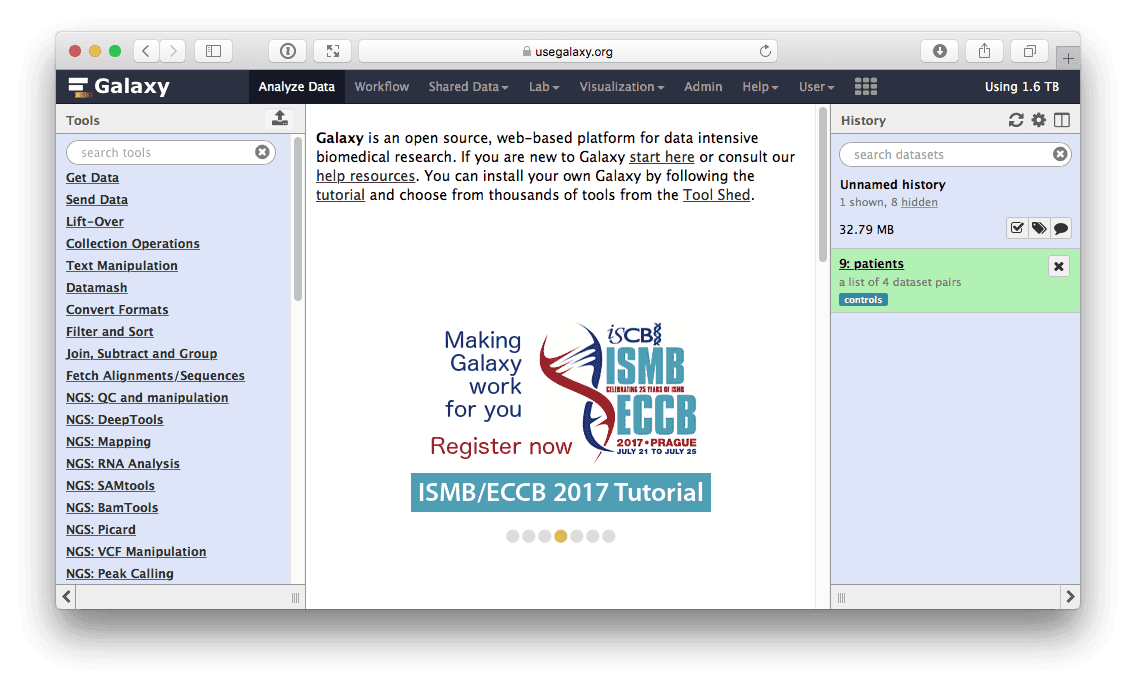 |
| Figure 11. A tagged collection. The tag “controls” is added as previously described. |
At this point we map the contents of the collection using NGS: Mapping → BWA-MEM:
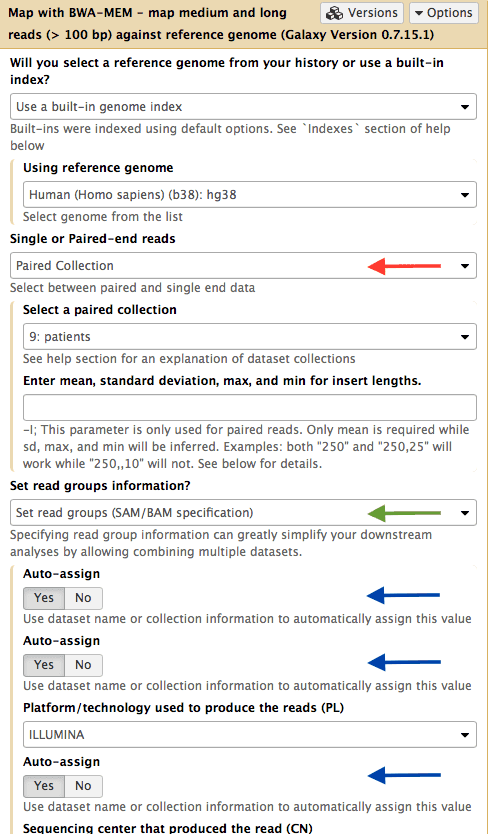 |
| Figure 12. Mapping a collection. Set input type (red arrow) to “Paired Collection”. This will allow selecting a collection from the history. Set readgroup dropdown to “Set readgroups (SAM/BAM specifications” (green arrow) and switch the three “Auto-assign” controls to “Yes” (blue arrows). Run the tool. |
Mapping produces another collection containing a list of BAM datasets produced by BWA. In other words every time a tool is run using a collection as input, Galaxy actually runs the tool N times on N collection elements (or a dataset pair in the case of paired data) and bundles outputs into an output collection.
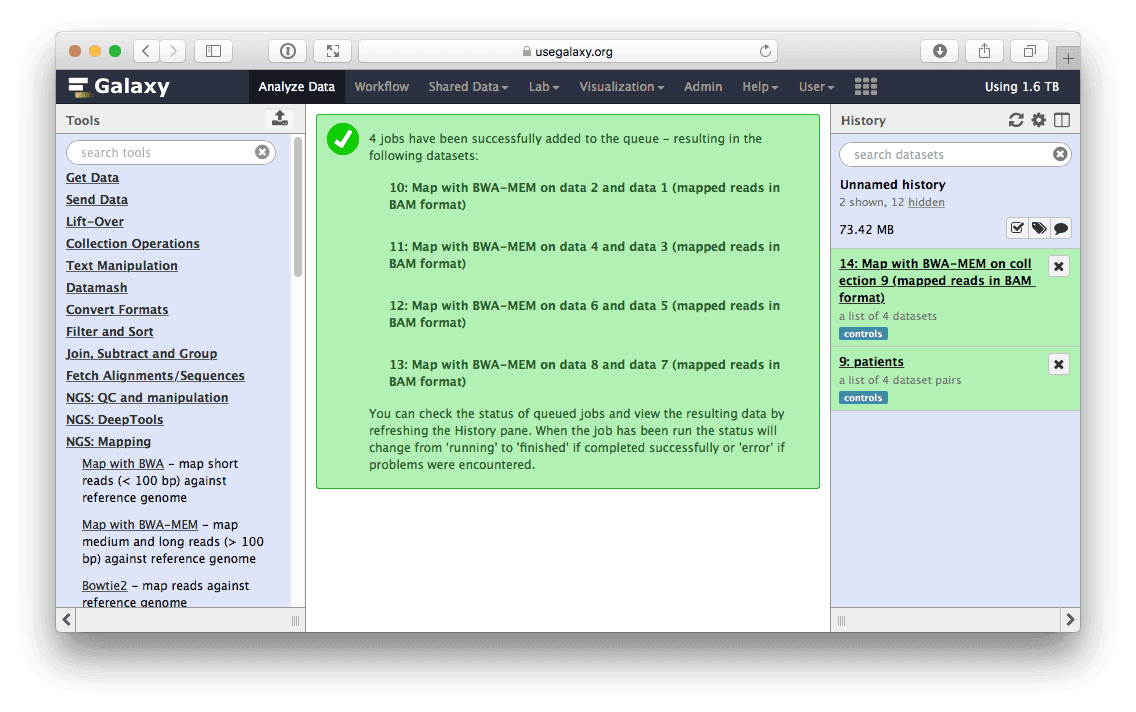 |
| Figure 13. Mapping result. Running BWA will produce another collection in the history. Note that tag has propagated onto this collection. This collection contains a list of BAM datasets. |
Since we have assigned readgroup information while running BWA we can now merge a collection into a single BAM dataset using NGS: Picard → MergeSam:
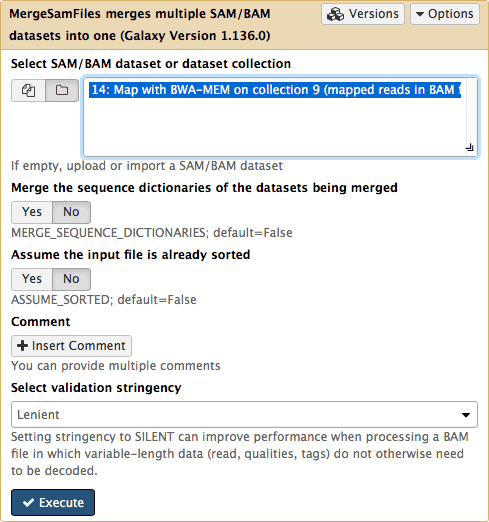 |
| Figure 14. Merging collection into a single BAM dataset. Note that in order to make collections visible to the tool interface you need to click on the folder button. |
We have now aligned our reads and merged them to a single file for downstream analysis. Using collections allowed us to execute these operations on groups of samples with minimal clicking.
Other analysis outlines
Going forward collections will become the dominant way to represent and manage data within Galaxy. Here are some examples of how collections can be used in typical NGS applications. The first example (below) provides a high level summary of how collections will help performing a typical RNA-seq analysis of differential gene expression:
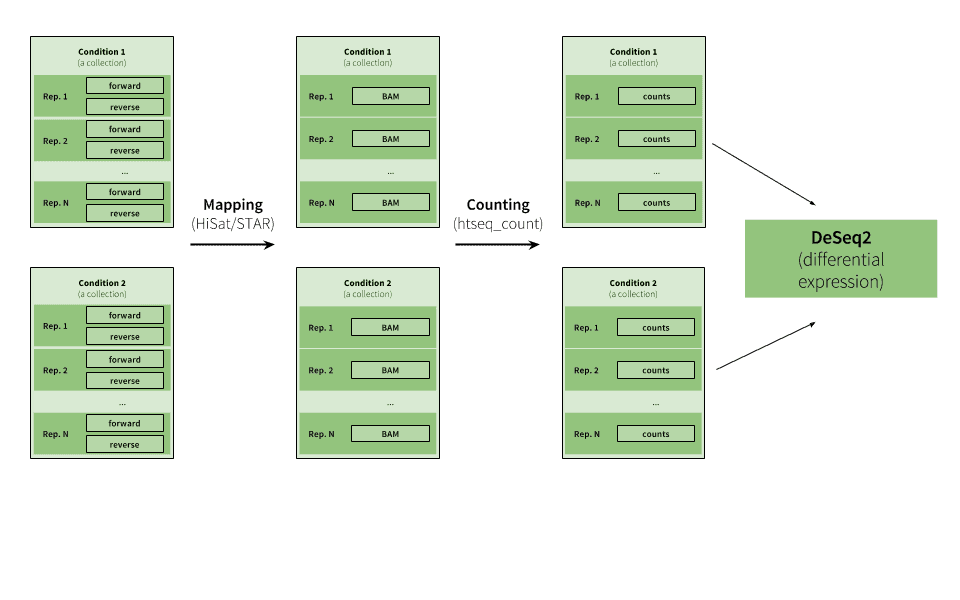 |
| Figure 15. Example of RNA-seq analysis. This example starts with multiple paired end datasets representing two conditions with several replicates. The analysis proceeds by creating two collections that are analyzed in parallel (the tagging feature described above should make this analysis very straightforward), where reads are mapped to a genome and the mapped reads are then counted upstream of the DeSeq2 tool, whcih reduces the collections into a single table listing changes in gene expression between the two conditions (see RNA seq tutorial for a comprehensive explanation). |
The next analysis highlights main steps if initial processing of ChIP-seq data:
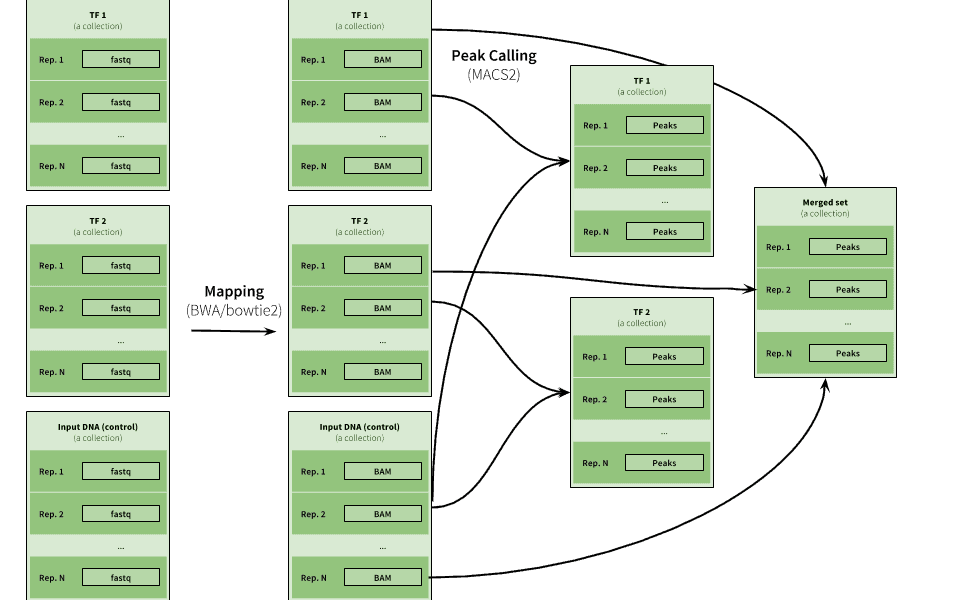 |
| Figure 16. Example of ChIP-eq analysis. Here three collections are used to represent data for two ChIP experiments (TF1 and TF2) as well as input DNA control data. The peak calling is performed on individual pairs of TF and input data as well as on combination of all datasets. |
The future
The future improvements of dataset collections will allow representing complex experiments such as the ones shown in the two previous figures in a single collection.
If things don’t work…
…you need to complain. Use Galaxy’s support forum to do this.